The GA platform is one that intimidates most marketers at first but with the right marketing objectives in mind, you can leverage these free insights to understand more about your websites’ visitors in addition to getting a bird’s eye view of traffic across all your
marketing products.
Get the infographic!
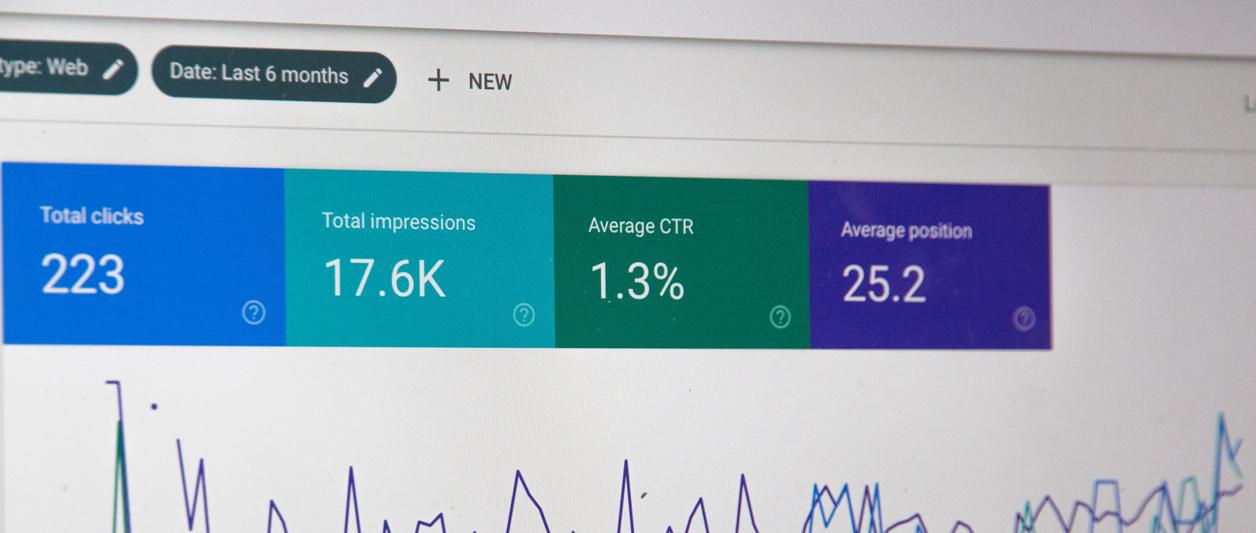
Google Analytics is one of the most widely used tools to monitor site traffic metrics and give brands a general understanding of how their sites’ pages are performing in terms of visits and how many of those visits are actually converting into sales. That being said, one of the most challenging marketing exercises is figuring out if the audiences visiting your website are actually your target audiences or they are visitors which are being pushed to the site through other channels such as social media, but there’s no real purchase intent when comes to having an affinity to your product’s value. Let’s dive in.
BEHAVIOR FLOW REPORT
The Behavior Flow report is such a great resource for accessing a visualization of the paths users have traveled from different screens and pages. This report can help you understand the content that keeps users interested in your unique value proposition also helps identify potential issues in terms of usability and relevance in the event some pages are experiencing really high bounce and exit rates.
According to Google’s Analytics instruction page, the behavior flow can answer questions like:
- Is there an event that is always triggered first? Does it lead users to more events or other behaviors?
- Are there paths through your mobile app or site that are more popular than others, and if so, are those the paths that you want users to follow?
- Did users go right from product pages to checkout without any additional shopping?
By understanding how users navigate your content, it’s much easier to have a holistic view of what’s working for your marketing content and what needs to be repurposed or just removed from the user experience altogether.
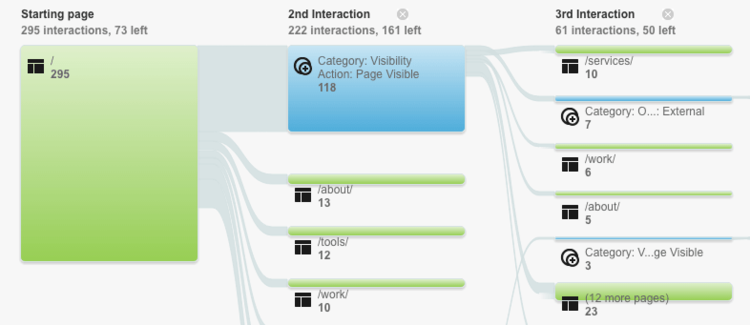
Source: marketlytics.com
ACTIVE USERS
Targeting is always half the challenge. Whether it’s focusing on traffic from social media or direct, many times brands experience high traffic but with little or no conversion. This usually leads to the inference that the audiences being targeted are not the audiences that will actually have a consumer intent to purchase a product or service. If the numbers are below expectations, reevaluate your marketing efforts to see whether you’re targeting the appropriate audiences and whether your ads are winning auctions.
You can also look for any negative press or social content that might affect traffic. In cases where you have a lot of 1-Day Active Users but the numbers drop off for long term users, that can mean you have the ability to drum up momentary enthusiasm but the content marketing program is not effective in keeping long term interest. For example, many users might be downloading an app but finding that it doesn't meet a need they have or that it doesn't capture their interest.
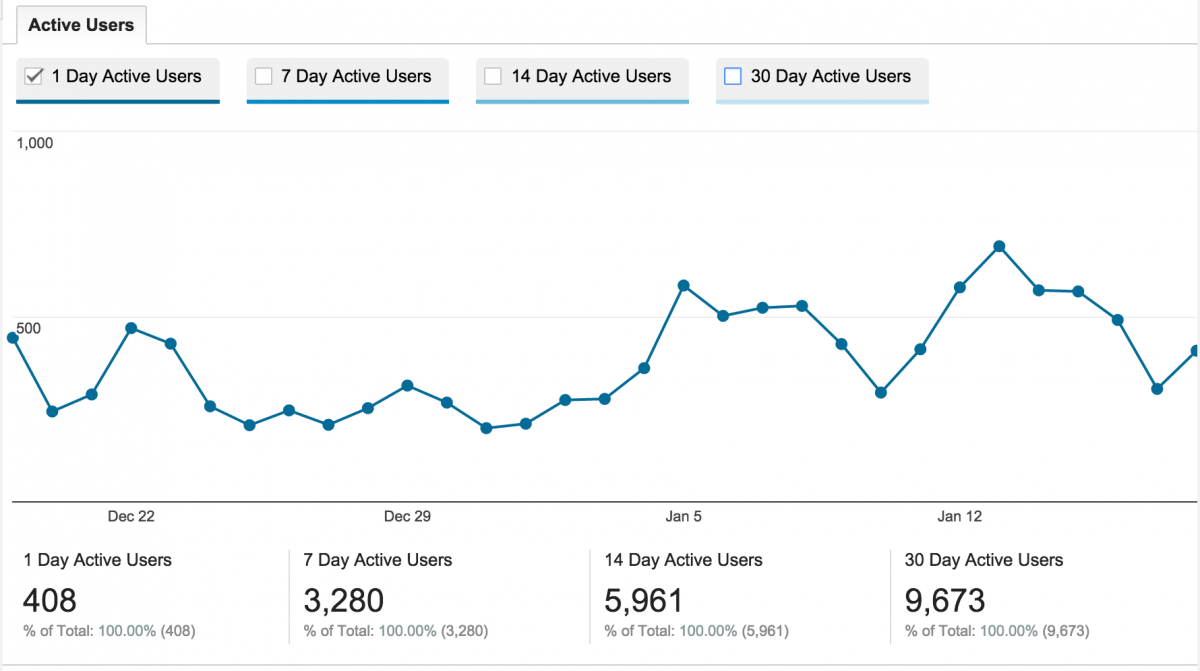
Source: amazeemetrics.com/en
COHORTS
The cohort analysis provides complementary data to your core reports and helps your marketing team understand the behavior of specific groups of users apart from your user population as a whole. According to Google, you can use cohort analysis to:
Examine individual cohorts to gauge the response to short-term marketing efforts like emails or notifications to users.
See how the behavior and performance of individual groups of users changes day to day, week to week, and month to month, relative to when you acquired those users.
Organize users into groups based on shared characteristics such as Acquisition Date, and then examine the behavior of those groups according to metrics like User Retention or Revenue.
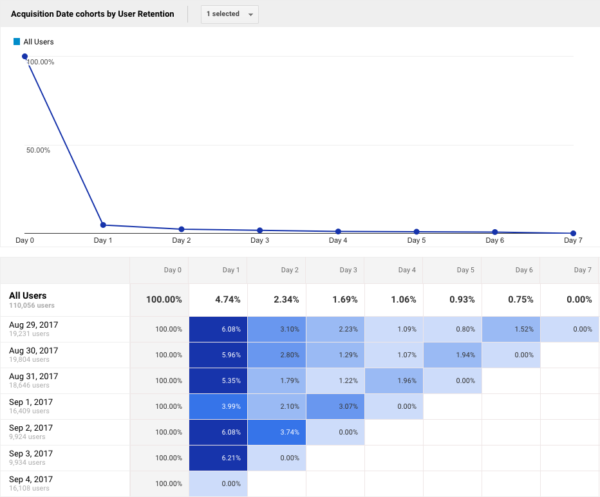
Source: yoast.com
SITE SEARCH
Starting with the Behavior Analysis Search Overview tells how many of your visitors to search your site, the search terms your visitors use and how your visitors subsequently engage with your site. Having a search bar is key for your user’s experience in the event they’re not finding what they want readily, search allows them to get to what they need in a hyper convenient way.
That then leads us to the usage report which gives a breakdown between visits that included an internal site search and those that did not. This gives you a great overview of the search feature’s effectiveness. Together with the search terms report, which gives a breakdown of the popular search terms your visitors use, as well as other parameters, such as the number of times they viewed search results, exits from your site following search, time spent on the site resulting from the user’s search, etc. you’ll have great insights on what visitors are looking for within your website’s content.
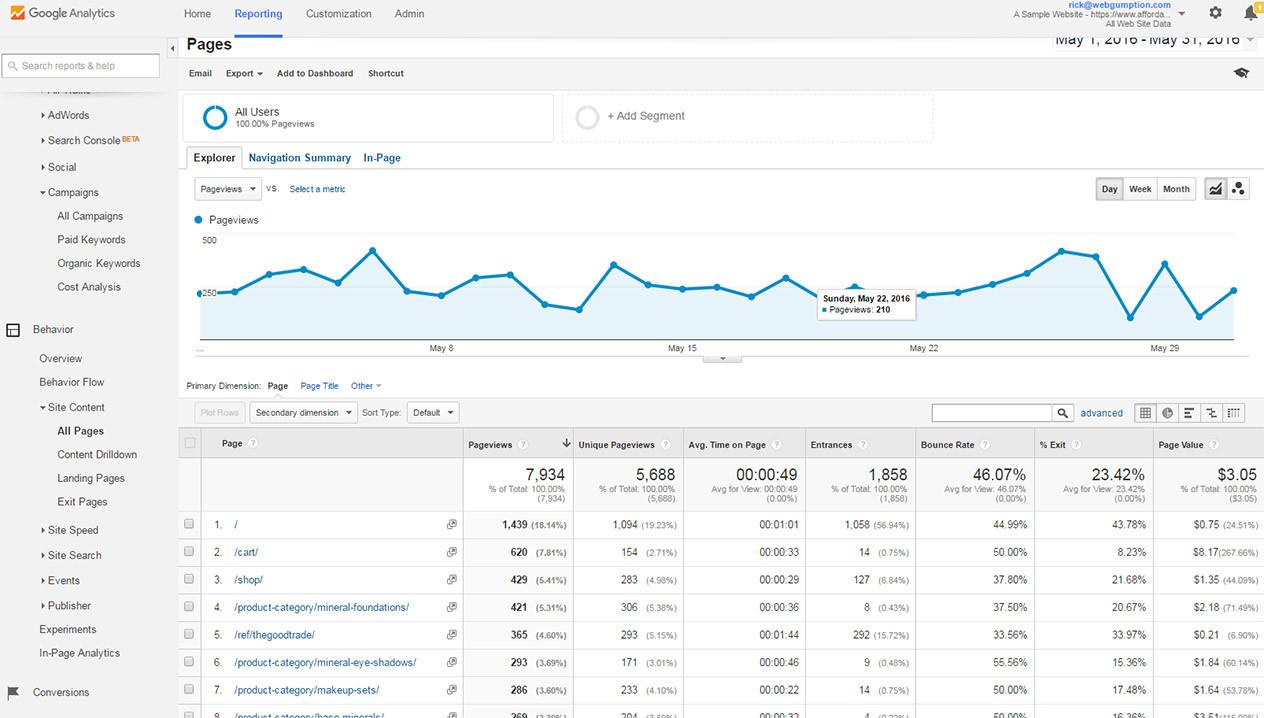
SITE CONTENT
The Behavior Analysis Site Content reports are THE reports to assess the effectiveness of your website’s content marketing programs. Based on the data produced, you and your team can assess whether the design and brand persona you’ve created with the narratives on your website, actually are performing against the goals you’ve set for your website’s objectives. These reports include:
- All Pages
- Content Drilldown
- Landing Pages
- Exit Pages
Let's Get to Work.
Have an unsolvable problem or audacious idea?